How to detect memory leaks in C++ programs on macOS
一段很典型的内存泄漏C++ 代码如下:
1 | int main(int argc, const char **argv) |
如何在庞大的 C++ 项目代码中找出类似的问题呢?
libgmalloc
苹果提供了内存调试功能:Guard Malloc,用于debug 内存问题。 man libgmalloc 可以查看更多使用信息。
开启libgmalloc的记录 malloc 调用日志的功能,在执行程序前设置环境变量MallocStackLogging=1,如:
1 | MallocStackLogging=1 ./my_tool |
日志会写到一个临时文件中:
my_tool(38364) MallocStackLogging: stack logs being written to /private/tmp/stack-logs.38364.103f3a000.my_tool.19n2JH.index
my_tool(38364) MallocStackLogging: recording malloc and VM allocation stacks to disk using standard recorder
需要注意的是,在程序退出时,这个调用日志文件会被自动删除:
my_tool(38364) MallocStackLogging: stack logs deleted from /private/tmp/stack-logs.38364.103f3a000.my_tool.19n2JH.index
所以需要将程序在结束时最好 block 住,以便分析日志文件:
1 |
|
The leaks Tools
另外,可以直接用 macOS 检测内存泄漏:/usr/bin/leaks (详见:the leaks Tool )
终端中执行 man leaks 查看使用手册。
leaks 使用方式很简单,指定 pid 即可 attach 到执行中的程序:
1 | # pid=38364 |
结合起来就是:
- 修改 C++ 程序 main 函数,使其在结束时 block,重编程序
- 设置环境变量
MallocStackLogging=1,执行程序。 - 在程序执行结束时,亦即 block 时,执行
leaks,保存 memory graph文件 ⌃+C结束程序- 使用
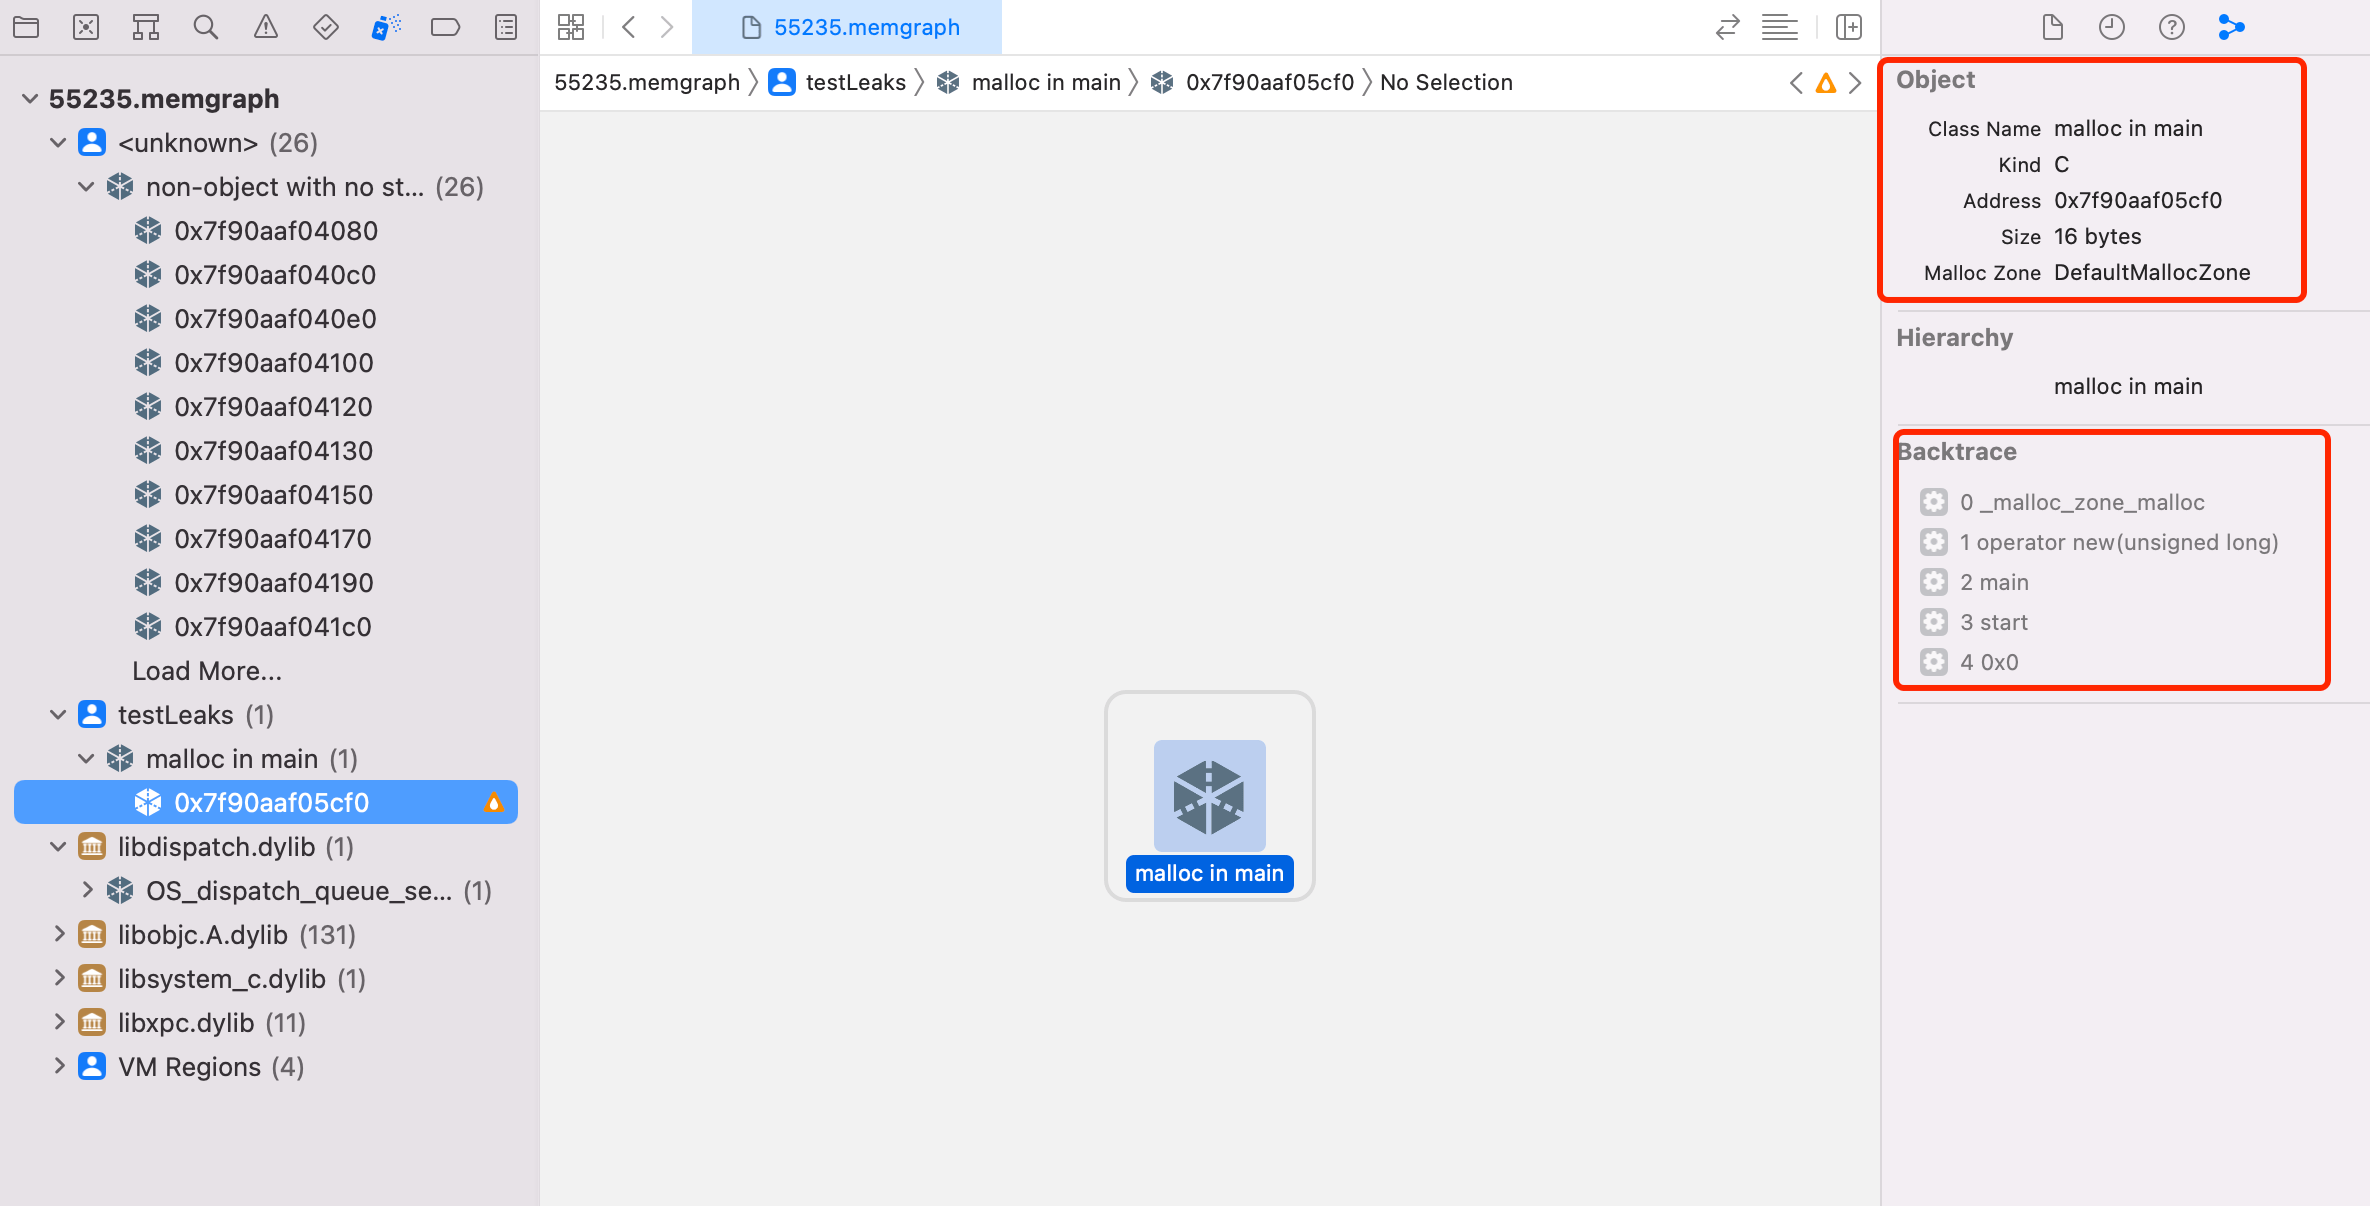
Xcode Memory Graph Debugger打开 memory graph文件,分析内存泄漏
Xcode Instruments
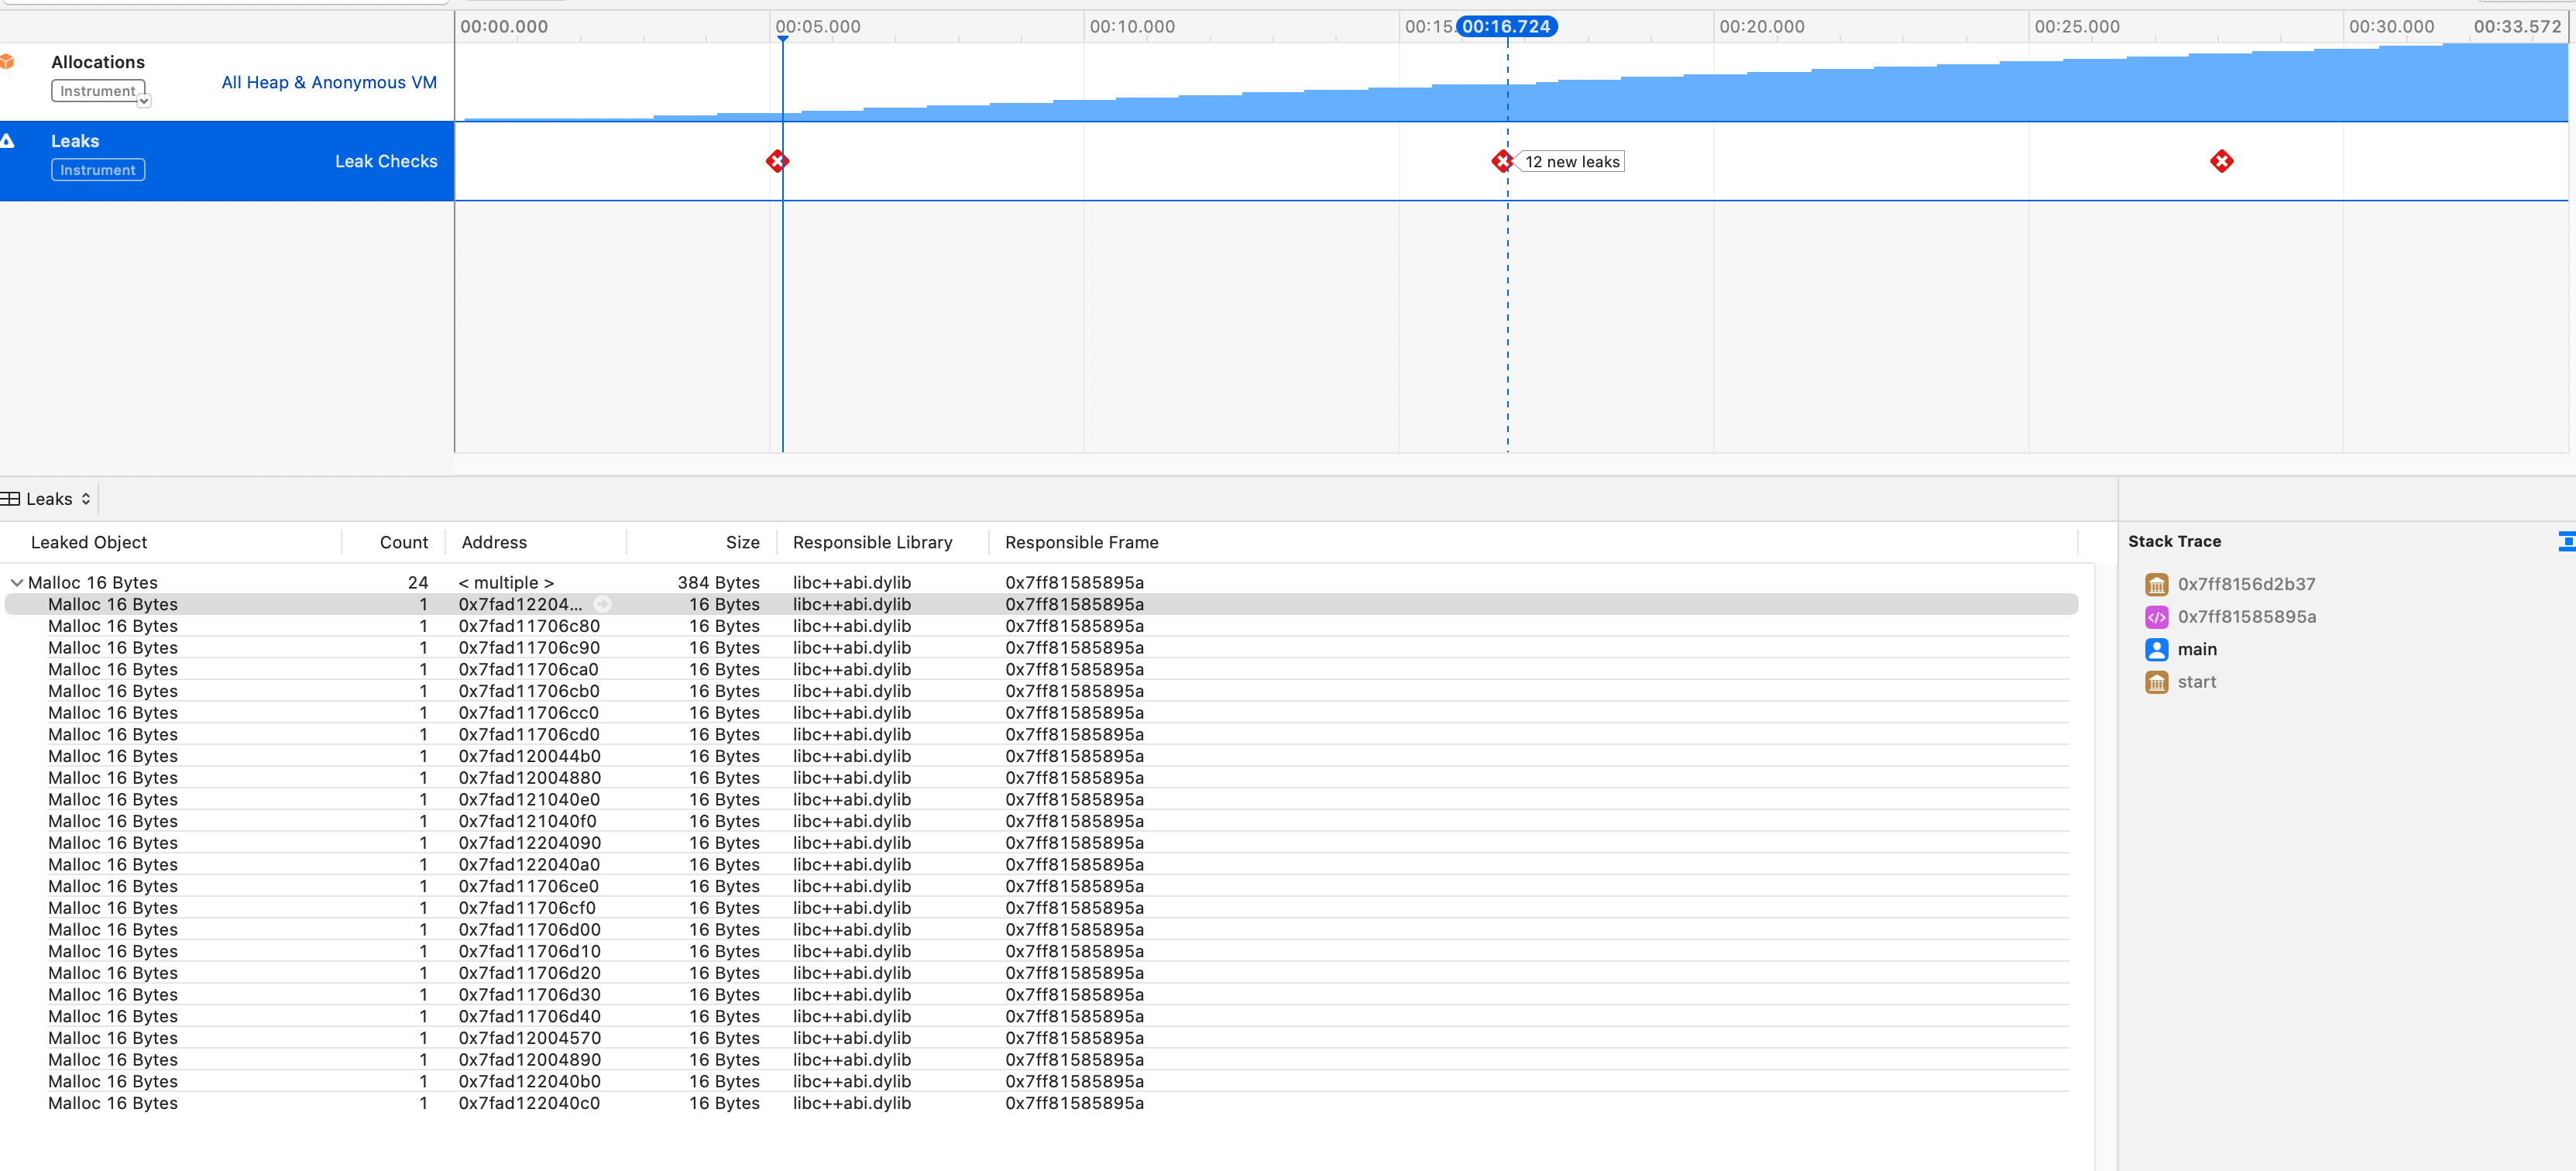
另外一个内存检测工具是使用Xcode Instruments。
从命令行启动 Instruments, 并使用内置的 Leaks 模板:
1 | xcrun xctrace record --template 'Leaks' --target-stdout - --launch -- ./my_tool |
在程序退出时,自动保存trace文件:
Starting recording with the Leaks template. Launching process: my_tool.
Ctrl-C to stop the recording
Target app exited, ending recording…
Recording completed. Saving output file…
Output file saved as: Launch_my_tool_2023-07-03_15.21.06_AA4C3897.trace
需要注意的是,程序不能退出的太快,不然可能来不及注入分析工具就退出了╮(╯_╰)╭ :
Run issues were detected (trace is still ready to be viewed):
[Error] Failed to attach to target process
* [Error] Failed to execute loader thread for /Applications/Xcode.app/Contents/SharedFrameworks/DVTInstrumentsFoundation.framework/Resources/liboainject.dylib in target; target process 82675 likely exited
另外,Instruments 每 10 秒执行一次内存泄漏检测,所以程序执行时间最好大于 10 秒。
在 main 函数中添加一个 sleep 等待 attach,如:
1 |
|
LSan (LeakSanitizer)
x86_64 的 macOS 可以使用LeakSanitizer (AddressSanitizer 内置的一个内存检测工具)。
1 | clang++ -std=c++17 -fsanitize=address -g main.cc -o my_tool |
但比较遗憾的是,Apple 的 Clang 阉割掉了 AddressSanitizer 的 LeakSanitizer,所以需要用 homebrew 安装 llvm 的 clang,详见: https://github.com/google/sanitizers/issues/1026#issuecomment-997350809